
There is a statistical observation that has long been known, that in tables of numbers, statistics, etc. numbers whose first non-zero digit is “1” occur with more frequency (just under a third of the time) than other digits and the probability falls with each succeeding digit (3 is less common than 2. 4 is less common than 3. And so on.
And this is very broadly applicable. Newcomb, in 1881, noted that the first pages in log tables (this was before calculators and electronic computers; calculating things like logarithms was a long, painstaking, laborious task, so they were compiled into large tables and bound into books so people could just look them up) were invariably more worn than succeeding pages.
Benford’s law can be an excellent indicator of whether a set of numbers occurs “naturally” or if someone has been manipulating them. Manipulation tends to throw things off. As just one example, the IRS uses Benford’s Law as one of its “red flags” to see whether an audit is needed for possible tax fraud.
Now, we come to the recent election. For the most part, results actually follow pretty closely to Benford’s Law with no more variation than you would expect from chance. Example being Miami-Dade:
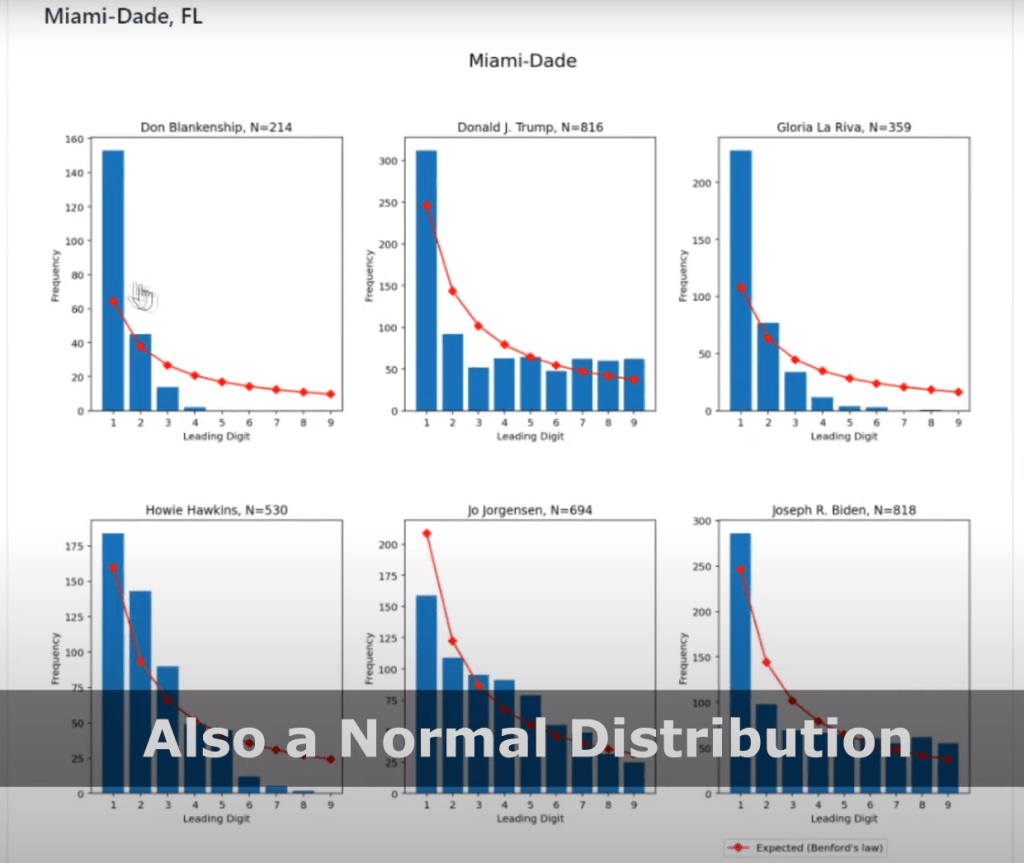
But there are a few places where things are a little different. Most of the candidates results follow a normal distribution, in accordance with Benford’s Law. But, well, one of these things is not like the other:
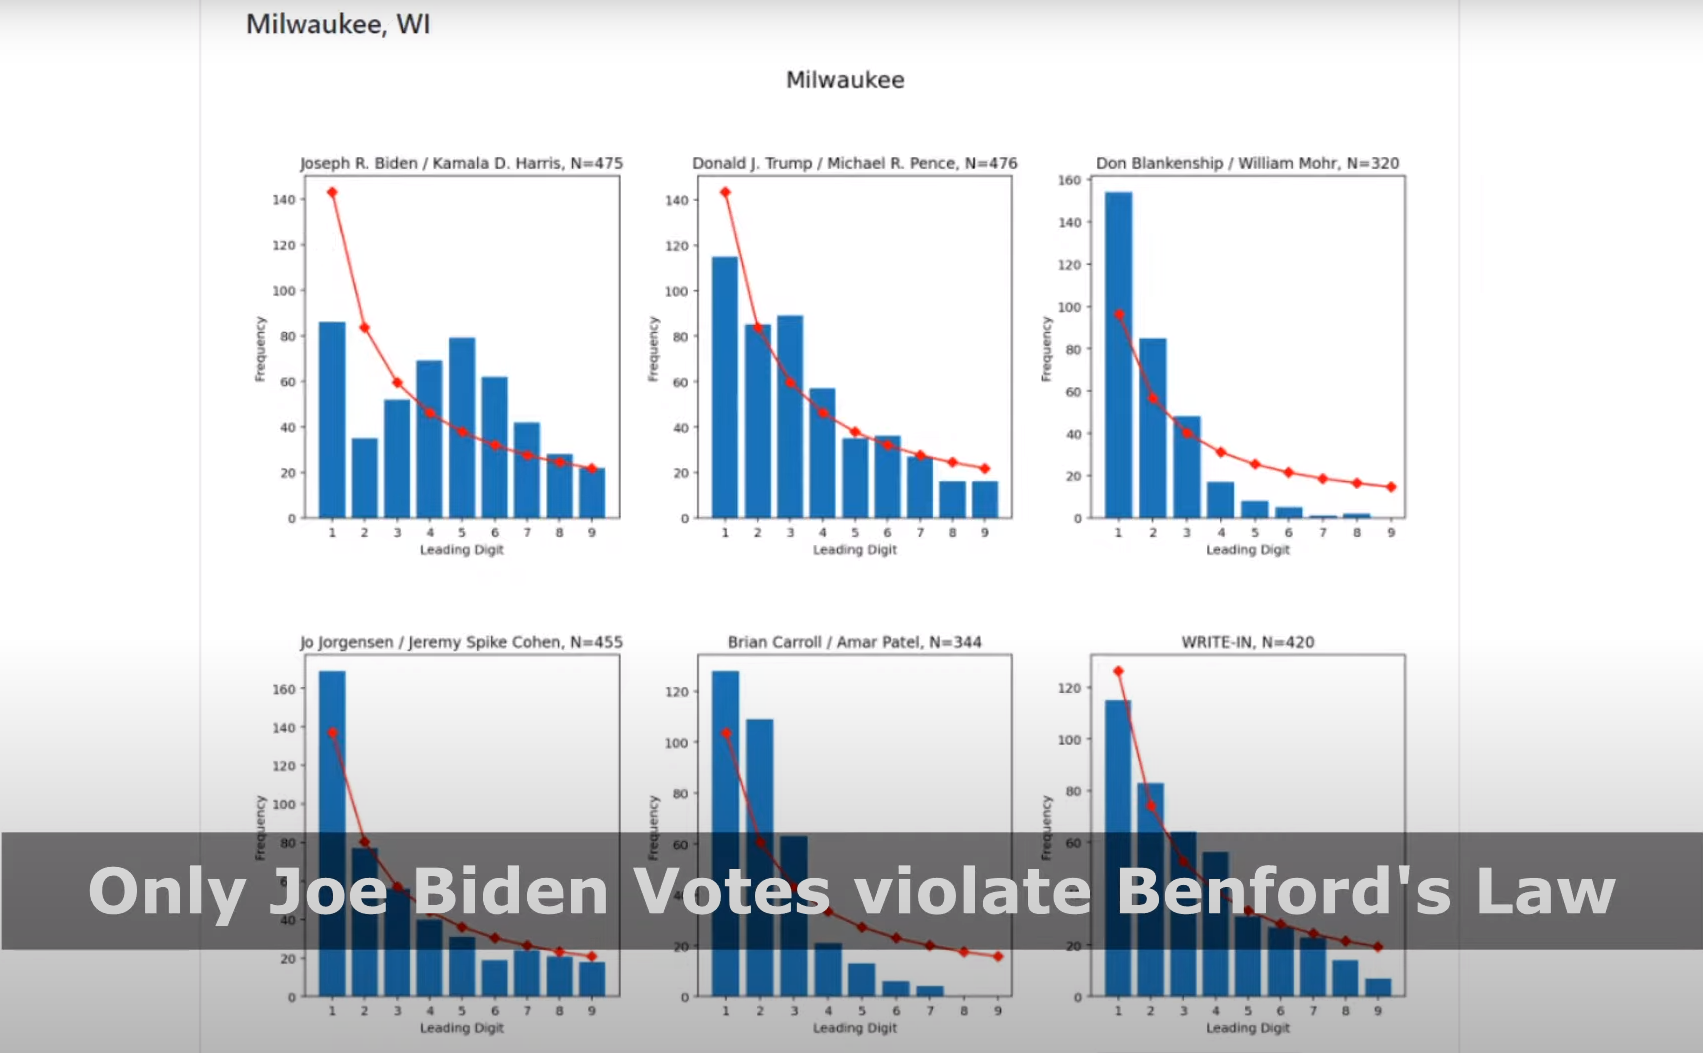
Now, this isn’t proof of anything. But how strange that only one candidate’s results violate Benford’s Law, and only does so in a handful of places which just happen to be the places this candidate needs to swing certain states leading to that magical 270 Electoral College votes.
And this same candidate just happened to rack up large numbers of votes in the dead of night, bug chunks without a single vote for other candidates. And this candidate just happens to have a lot of ballots cast where the only vote was for President, not any of the down-ticket races. And…
Well, my friend Larry Correia, a former accountant with a great deal of experience with audits and also in recognizing the red-flags that indicate the need for an audit lists some of the many red flags here and more here.
But the media (including Fox, which appears to have sold out completely at last) is all:
And you can believe as much of that as you want to.

Can you show ballots to support your claim “lot of ballots cast where the only vote was for President, not any of the down-ticket races”?
LikeLike
One observes that even here the trolls abound. The Democrats are pulling out all the stops.
LikeLike
I don’t generally get a lot because I’m rather small potatoes (I’ve got no illusions on that score), so normally it’s just a game of “whack a troll” set on a relatively low difficulty level.
LikeLike
One source: https://twitter.com/raheemkassam/status/1325193658170134531
One can also look at the total number of votes cast in various races and see the numbers not matching up. Typically about 3% of people in a Presidential election year vote only for President. This time around it looks like it was something like 19%.
There are more than enough red flags to indicate the need for a thorough audit of not just the results but the process. It’s conceivable (although not, IMO, likely at all) that all of these things were the result of just blind chance–that’s the way things happened to fall. Long shots do, in fact, occasionally come up although some of these look more like “not even once in the entire history of the Universe” unlikely, but, still, it’s just faintly possible.
Even if the Biden actually did win by an honest vote and not as a result of fraud, an audit would remove the cloud, the uncertainty, that would always otherwise hang over him.
We need a deep, thorough, transparent audit.
LikeLike
I’ve gotten into a lot of debates over the Binford’s Law stuff lately. It’s odd how folks said for years that it could help detect fraud, then all of a sudden the story changes. “Oh, no, we didn’t mean that kind of fraud!”
Shooting from the hip, I’d hypothesize that the reason people say it can’t work with elections is because the charts never line up with Benford’s Curve. What nobody wants to admit, though, is that it is working just like it’s supposed to…. but also exposing the rampant corruption in just about every election it’s tried on.
That’s why you see the down-ballot races always looking more and more inline with the Benford Curve. Those are the races nobody was worrying about or trying to fix.
In the case of the 2020 election, you see the corruption in biden’s chart most strongly because it’s his party that’s doing the corruption and trying to fix things in his favor. Trump is obviously impacted by this to a far greater degree than the Libertarian candidate because nobody was worried about her performance taking away from the biden campaign’s performance.
As you noted, every time the charts are made up, you see the really big discrepancies only in States that biden needs to win. When you focus in a little tighter and examine the individual candidates, it’s always biden who gets the helping hand, throwing the Curve off significantly. Trump, Jo, the local sheriff…. the further away you get from biden’s main threat, the more the numbers align with Benford’s Curve.
Go back through history and I’ll bet you’d find the same pattern of behavior in most any election you tried it on. It’s not that the BLA doesn’t work, but that it always shows the corruption at hand so folks think it’s not working rather than think it’s showing corruption.
LikeLike
The thing is, it does line up for most of the candidates in most of the races. Just a few key races in key battleground races where it doesn’t, and it fails to line up for one candidate (or two: removing votes from a candidate will cause anomalies just like adding votes will). The State Department uses it to assess the honesty of elections in places like Central America. But suddenly, now, when it produces results that certain folk don’t want to listen to, it’s invalid?
Pull the other one; it’s got bells on.
Or as I am wont to say: Tell it to the Marines because the Air Force ain’t buying.
LikeLike
I found this explanation of Chicago rather strong at the precinct level:
Where Benford’s law works distributions over multiple orders of magnitude. But at the precinct level in Chicago, over 98% have Biden votes between 100 and 1000, so all three digits, so most first digits are 3, 4, 5.
I suspect there are better ways to use it, perhaps at multi-precinct county levels or something, but that needs to be made more clear in any explanation.
And of course, the more complex the requirements for the law to work, the less reliable it seems.
I liked this explanation and referenced it on Neo’s site:
https://www.thenewneo.com/2020/11/14/roundup-14/#comment-2525266
LikeLike